How to Read the Exact Report Your Machine Would Send to shell.online
Preview the gathering report with shell stats before it sends anything: what each count comes from, what --dir scopes, and what a linked machine sends.
Artemii Amelin9 min read
Contents
- Step 1: Check that your CLI has the command
- Step 2: Run the preview in a repository
- Step 3: See where each number comes from
- Step 4: Know what --dir changes and what it does not
- Step 5: Decide whether to turn the gathering on
- What else a linked machine sends
- What this does not tell you
- Where Pilot Protocol fits
Warp disclosed a security incident this week that lands on the data developer tools collect about their users. In a post on X, chief executive Zach Lloyd said that on Friday, October 23, Warp became aware of what he called active and narrow-banded exploitation of a vendor in its infrastructure. BleepingComputer reported on October 27 that agent decision logs and user telemetry were exposed, that Lloyd put the affected share at roughly 1% of Warp users, and that CrowdStrike had been brought in. Warp has not named the vendor, and it has not said whether the logs held source code, prompts or credentials. Let's Data Science's summary notes that the exposure came through a third party, not through Warp's own systems.
Telemetry is usually explained in a settings page. Warp's privacy page says what its "Help improve Warp" switch collects and names the third parties that receive crash reports and analytics. That is better than most tools manage, but it is still a paragraph you take on trust. When an agent runs in your terminal, anything it prints or decides can end up in a log somewhere, and the useful question is what a tool sends about your work and how you can check it yourself.
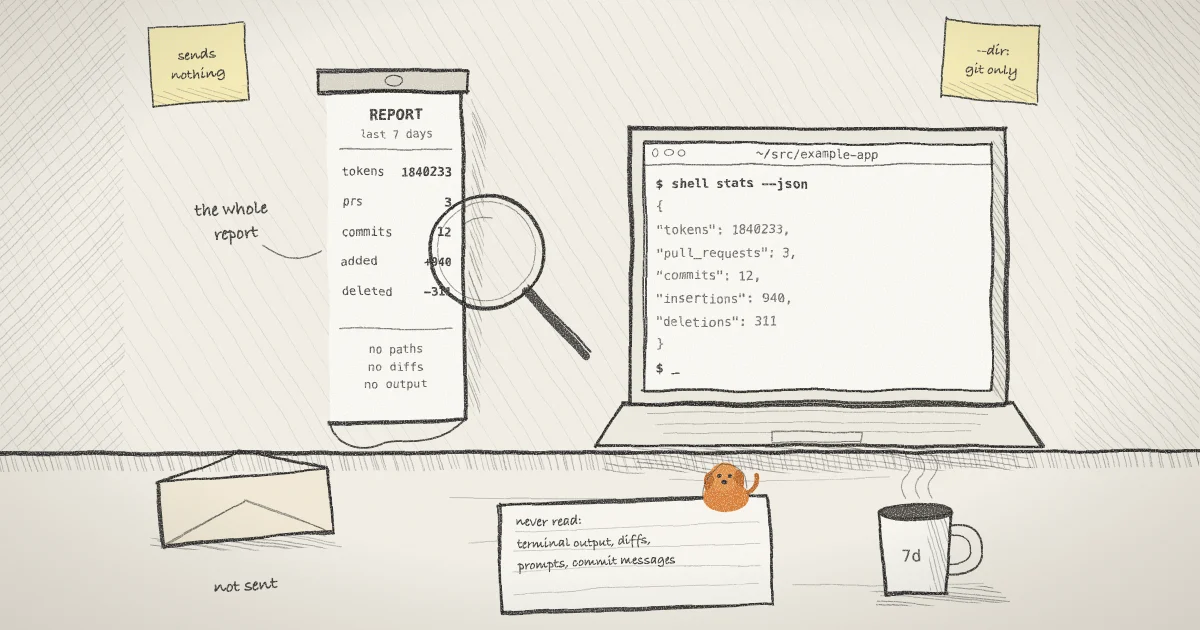
One shell.online feature reads your work in order to report numbers about it: the optional gathering in Shell Keep, the game in the web app. It never runs unless you turn it on. Before you do, you can print the exact report your machine would send, on your machine, with nothing sent. This guide runs that preview, reads what each number comes from, shows the one flag that scopes less than it looks like, and lists what else a linked machine sends so the report is not mistaken for the whole picture.
Step 1: Check that your CLI has the command
shell stats first appears in the v0.16.1 release, and the current release is 0.25.0. Check your version before anything else:
shell --version
shell help statsThe first command prints the version. The second prints a page titled "What this machine would report" with the usage line shell stats [--json] [--days N] [--dir PATH].
On a CLI older than 0.16.1, stats is not a subcommand, so shell stats is read as a program to start and share. On a Mac running 0.11.1 it failed with start stats: exec: "stats": executable file not found in $PATH. If a program called stats happened to be on your PATH, that program would start inside a new shared session instead. Run shell --version first, and update with the installer from the docs if it is old. The command reference lists every subcommand the current release has.
Step 2: Run the preview in a repository
Change into a repository you work in and run the command with no flags:
cd ~/src/example-app
shell statsIt prints a short table. The numbers below are invented, but the layout is what the command prints:
Over the last 7 days, this machine would report:

  tokens           1840233
  pull requests    3
  commits          12
  lines            +940 -311

That is the whole report. No file contents, no diffs, no commit
messages, no branch names, and nothing from any terminal session.If a source could not be read, a line such as not read: gh: unavailable appears above the closing sentence. A machine without git, the GitHub CLI or any agent history is normal; that source reports zero and the others still count. --days changes the window from the default of seven days, and a value below 1 is refused with exit status 2.
Add --json to see the report as data:
shell stats --json --days 3{
"tokens": 412907,
"pull_requests": 1,
"commits": 4,
"insertions": 210,
"deletions": 38,
"error": "gh: unavailable"
}The flag's own description is "print the report as JSON, exactly as it would be sent". When the machine sends a real run, it adds one field, an id named after the request, so a report sent twice after a lost reply is counted once. There is no field for a path, a branch or a message.
Step 3: See where each number comes from
The collector is one file, internal/stats/stats.go, and it is short enough to read in one sitting. Each number has one source.
Commits and lines come from git log with --since, --no-merges and --numstat. That option prints added and deleted line counts and the path for each changed file. shell adds up the counts and throws the path away. Binary files, which git marks with two dashes instead of numbers, are skipped. You can run the same command yourself and compare:
git log --since="7 days ago" --no-merges --pretty=tformat:%H --numstatPull requests come from gh pr list with --author @me --state open --limit 100 --json number. Asking only for the number field means titles and branch names never reach shell. The count therefore stops at 100.
Tokens come from the agents' own history files. shell walks ~/.claude/projects and ~/.codex/sessions, opens each .jsonl file modified inside the window, and decodes every line into a structure that only has token-count fields. Anthropic's data usage page says Claude Code keeps its session transcripts in plaintext under ~/.claude/projects/ for 30 days by default, so these files hold your prompts and the agent's replies. They stay behind because Go's encoding/json ignores object keys that have no matching struct field. Input, output and cache-creation tokens are added up. Cache reads are skipped on purpose, and lines in a different shape add nothing rather than raising an error.
Step 4: Know what --dir changes and what it does not
The --dir flag looks like it scopes the whole report to one repository. It does not. Only git takes the directory. The GitHub CLI runs in whatever directory you are in, and the token count reads every history file under your home directory.
cd ~/src/example-app
shell stats --dir ~/src/side-projectRun from inside the shell.online repository on a Mac with --dir pointed at a scratch repository, the commits and lines came from the scratch repository while the pull request count was the open pull requests in the shell.online repository. Outside any git repository, gh pr list fails and the report says gh: unavailable. So treat the token line as machine-wide and the pull request line as belonging to your current directory.
Step 5: Decide whether to turn the gathering on
The preview sends nothing. A comment at the top of the command says so plainly: nothing in it talks to the network. A real run needs three things. The machine must be linked with shell auth, as the app guide describes, its machine agent must be running (shell agent in a terminal, or the background daemon from shell daemon start), and you must open "The gathering" in Shell Keep at app.shell.online and press "Turn gathering on". The notice there lists what the machine would read and what it never reads before it shows the button.
The request the browser sends carries no arguments at all. It cannot name a directory or a repository, so what is read is decided on the machine by the same collector the preview runs. On the service side, the gathering route answers with 403 and "the gathering has not been agreed to" both when a browser asks for a run and when a machine reports one without consent. It reads only the five counts and an error sentence cut to 200 characters, caps each count at ten billion, and stores the run with the machine's name and the time it ran. "Stop gathering" turns it off again, and each run is listed per machine with its counts.
What else a linked machine sends
The gathering report is small, and it is not everything. If shell whoami shows a linked account, the machine also publishes each session to that account: its name, the command line shell displays, its share link and whether it is read-only, encrypted or persistent. The relay carries terminal traffic as ciphertext and still sees timing, sizes, addresses, labels and lifecycle events, as the encryption page sets out and as the earlier post on what the relay sees walks through. Session summaries are off by default and turned on per session. The security page covers the rest, and the post on sealed team sharing walks through what linking a machine publishes.
OWASP's logging cheat sheet lists source code, session identifiers, access tokens and passwords among the things that should usually not be logged directly. A report made of five integers has nowhere to put any of them, and that is the property worth checking in any tool you give a terminal to.
What this does not tell you
- It does not cover the agents. Claude Code, Codex and the rest send prompts and output to their model providers and may send their own telemetry. The Claude Code page linked above lists the environment variables that switch its metrics and error reports off.
- It does not prove what the service stores. The preview shows what your machine would send. The service code is in the same repository, but a hosted deployment is something you trust, not something you can inspect from the CLI.
- Counts still say something. Token volume, commit counts and the times of runs describe how much you worked and when.
- The preview runs where you stand. A real run uses the machine agent's own process, so its git and pull request counts may come from a different directory than the one you previewed.
- It reports nothing about other sessions you shared. Terminal output is not read by the collector, and the gathering is separate from summaries and the audit log.
Where Pilot Protocol fits
shell.online is built by the team behind Pilot Protocol, and the gathering follows a rule Pilot's own writing keeps coming back to: do the reading where the data already lives and move only what is needed. The post on sharing models, not data applies that to research sites that cannot move raw datasets. Running an agent network without cloud dependency explains how Pilot agents keep their identity keys on the device and use direct encrypted tunnels, so a registry or relay operator cannot read what they exchange. If you are wiring agents on different machines together and want the same property for their messages, Pilot Protocol is where to start.
Read the report before you agree to it
Install or update the CLI, run shell stats --json in your repository, and compare it with the collector's source on GitHub.
Open shell.online on GitHub